United In Science 2020

A multi-organization high-level compilation of the latest climate science information

This report has been compiled by the World Meteorological Organization (WMO) under the direction of the United Nations Secretary-General to bring together the latest climate science related updates from a group of key global partner organizations – WMO, Global Carbon Project (GCP), UNESCO Intergovernmental Oceanographic Commission (UNESCO-IOC), Intergovernmental Panel on Climate Change (IPCC), UN Environment Programme (UNEP) and the Met Office. The content of each chapter is attributable to each respective organization.

Foreword by António Guterres, Secretary-General of the United Nations

This has been an unprecedented year for people and planet. The COVID-19 pandemic has disrupted lives worldwide. At the same time, the heating of our planet and climate disruption has continued apace. Record heat, ice loss, wildfires, floods and droughts continue to worsen, affecting communities, nations and economies around the world. Furthermore, due to the amount of greenhouse gases emitted in the past century, the planet is already locked into future significant heating.

The solution to slowing down the rate of global temperature rise and keeping it below 1.5°C is for nations to dramatically cut emissions, with the aim of achieving carbon neutrality by 2050. While emissions fell during the peak of the pandemic confinement measures, they have already mostly recovered to within 5 per cent of the same period in 2019 and are likely to increase further. This report stresses that short-term lockdowns are no substitute for the sustained climate action that is needed to enable us to meet the goals of the Paris Agreement on Climate Change.

Never before has it been so clear that we need long term, inclusive, clean transitions to tackle the climate crisis and achieve sustainable development. We must turn the recovery from the pandemic into a real opportunity to build a better future.

In order to do that, governments need consistent and solid science, backed by the strong collaboration of scientific institutions and academia, to underpin policy decisions that can tackle the greatest challenges of our time.

This report by the United Nations and global scientific partner organizations, provides an update one year from the first United in Science report, which was launched to inform the United Nations Climate Action Summit 2019.

United in Science 2020 presents a unified assessment of the state of our Earth system, detailing how emissions have evolved in 2020, and providing projections for the critical years ahead. The report further addresses key thematic issues on the front lines of climate change, such as water, oceans and the cryosphere and highlights the vulnerability of land-based, marine and air observing systems which are essential to underpin our understanding of climate science.

We need science, solidarity and solutions to tackle both the COVID-19 pandemic and the climate crisis. I urge leaders to heed the facts contained in this report, unite behind the science and take urgent climate action to set a path towards a safer, more sustainable future for all.

Prof. Petteri Taalas, Secretary-General of the World Meteorological Organization

António Guterres

Secretary-General of the United Nations

Foreword by Prof. Petteri Taalas, Secretary-General of the World Meteorological Organization

2020 has been a remarkable year in many ways. Not least of course because of the global pandemic, impacting lives and livelihoods across the planet like never before. This year has also been remarkable in terms or our climate, continuing the trend we have seen in recent decades.

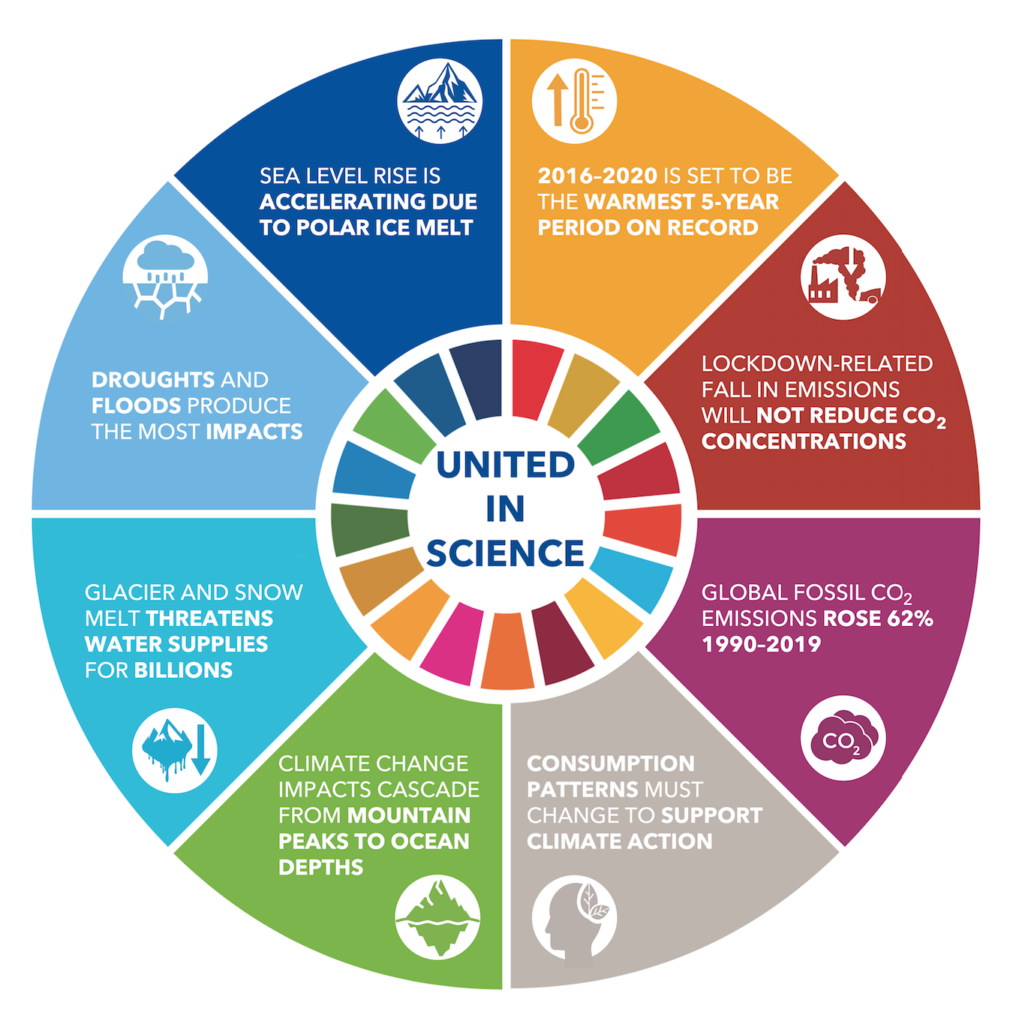
Greenhouse gas concentrations – which are already at their highest levels in 3 million years – have continue to rise, reaching new record highs this year. Meanwhile, large swathes of Siberia have seen a prolonged and remarkable heatwave during the first half of 2020, which would have been almost impossible without anthropogenic climate change. And now 2016–2020 is set to be the warmest five year period on record. This report shows that whilst many aspects of our lives have been disrupted in 2020, climate change has continued unabated.

Despite the challenges that 2020 has brought, the scientific commuity have continued their important work at pace. Collaborating in new and innovative ways with an important mission in mind, to provide a robust, authoritative scientific evidence base for decision makers around the world.

United in Science 2020 delivers on this mission, presenting the very latest scientific data and findings related to climate change, relevant to this unprecedented year. This report is an example of the international scientific community’s commitment to strategic collaboration in order to advance the use of scientific evidence in global policy, discourse and action.

I would like to thank the many expert teams from our scientific partners in creating this report – Global Carbon Project, the Intergovernmental Panel on Climate Change, UNESCO-IOC, UN Environment Programme and the Met Office. Thanks to their excellent collaboration, the climate science community are able to unite to provide policymakers all over the world with the latest essential information in these unprecedented times.

Prof. Petteri Taalas, Secretary-General of the World Meteorological Organization

Prof. Petteri Taalas

Secretary-General of the World Meteorological Organizatio

Key
Messages

  • Concentrations of the major greenhouse gases, CO2, CH4, and N2O continued to increase in 2019 and 2020.
  • Overall emissions reductions in 2020 will lead to a small reduction in the annual increase of the atmospheric concentrations of long-lived greenhouse gases.
  • Sustained reductions in emissions are required to stabilize global warming.
  • Global fossil CO2 emissions reached a new record high of 36.7 Gigatonnes (Gt) in 2019, 62% higher than in 1990.
  • CO2 emissions will decline in 2020 due to confinement policies imposed in many countries. At their lowest point, in April, daily CO2 emissions were approximately at the level they were in 2006, and 2020 emissions overall are estimated to decline by 4% to 7% compared to 2019 levels.
  • Global CH4 emissions from human activities have continued to increase over the past decade. Current emissions of both CO2 and CH4 are not compatible with emissions pathways consistent with limiting global warming at 1.5 °C or well below 2 °C above pre-industrial levels, the goal of the Paris Agreement.
  • The 5-year period from 2016–2020 is expected to be the warmest on record with an average global mean surface temperature of 1.1 °C above pre-industrial era (1850–1900).
  • Arctic sea-ice continues its long-term downward trend. Global mean sea-level has been rising faster than the long-term trend. A greater loss of ice mass from the ice sheets contributed to an increased sea-level rise.
  • Major impacts have been caused by extreme weather and climate events. A clear fingerprint of human-induced climate change has been identified on many of these extreme events.
  • Human-induced climate change is affecting life-sustaining systems, from the top of the mountains to the depths of the oceans, leading to accelerating sea-level rise, with cascading effects for ecosystems and human security.
  • Impacts from climate-related changes in the ocean and cryosphere increasingly challenge efforts to develop and implement adaptation and integrated risk management responses.
  •  
  • Water is a key commodity that sustains livelihoods – water shortages for human consumption, food production and energy supply are major roadblocks for the Sustainable Development Agenda.
  • Water is a threat – floods and droughts produce the most severe impacts of all disasters worldwide.
  • Water is key for adaptation – climate change impacts are most felt through changing hydrological conditions including changes in snow and ice dynamics.
  •  
  • There is a growing chance of annual global mean near surface temperature temporarily exceeding 1.5 °C above the 1850–1900 pre-industrial level, being ~20% in the 5-year period ending in 2024.
  • There is a high risk of unusual regional rainfall over the period, with some regions experiencing increasing droughtrelated risks and others increased risks associated with heavy rainfall.
  • Within the next 5 years, the Arctic is predicted to continue to warm at more than twice the overall global rate.
  • The Emissions Gap in 2030 is estimated at 12-15 Gigatonnes (Gt) CO2e to limit global warming to below 2°C above pre-industrial levels by the end of this century. For the aspirational 1.5 °C goal, the gap is estimated at 29-32 GtCO2e, roughly equivalent to the combined emissions of the six largest emitters.
  • It is still possible to bridge the Emissions Gap – but this will require urgent and concerted action by all countries and across all sectors.
  • Looking beyond the 2030 timeframe, new technological solutions and gradual change in consumption patterns are needed at all levels. Transformational action can no longer be postponed.
  • The COVID-19 pandemic caused significant impacts on land-based, marine and air observing systems, which is affecting the quality of forecasts and climate services.
  • The pandemic demonstrated the vulnerability of components of the global observing system for weather, water, climate and environment and the need for investment to address this; it also demonstrated the resilience of a system-of-systems approach.


WMO LogoConcentrations of the major greenhouse gases, CO2, CH4, and N2O continued to increase in 2019 and 2020. Overall emissions reductions in 2020 will lead to a small reduction in the annual increase of the atmospheric concentrations of long-lived greenhouse gases. Sustained reductions in emissions are required to stabilize global warming.

Global levels of greenhouse gases

Levels of atmospheric carbon dioxide (CO2), methane (CH4) and nitrous oxide (N2O) continue to rise. Preliminary analysis of the data from a subset of the global greenhouse gas (GHG) observational network of the WMO Global Atmosphere Watch (GAW) Programme demonstrated that CO2 concentrations in the northern hemisphere exceeded 410 parts per million (ppm) during the first half of 2020.

A full analysis of the three main GHGs (Figure 1) shows the globally averaged atmospheric concentrations1 of CO2 at 407.8 ±0.1 ppm, CH4 at 1869 ±2 ppb and N2O at 331.1 ±0.1 ppb for 2018. The annual increases of the three GHGs (147% for CO2, 259% for CH4 and 123% N2O relative to pre-industrial, 1750) were larger in 2018 than the increases in the previous year and the 10-year averaged rate of increase (WMO, 2019).

United in Science_Figure 1.
Figure 1. (upper row) Globally averaged CO2, CH4 and N2O mole fraction in ppm (CO2) and ppb (CH4; N2O, respectively) and its growth rate (lower row) from 1984 to 2018. Increases in successive annual means are shown as the shaded columns in (lower row). The red line in (upper row) is the monthly mean with the seasonal variation removed; the blue dots and line depict the monthly averages.


Global average figures for 2019 will not be available until late 2020, but data from all global locations, including flagship observatories – GAW Global stations Mauna Loa (Hawaii) and Cape Grim (Tasmania) – indicate that levels of CO2, CH4 and N2O continued to increase in 2019 and 2020 (Figures 2 and 3). In July 2020, CO2 concentration at Mauna Loa and Cape Grim reached 414.38 ppm and 410.04 ppm, respectively, in comparison with 411.74 ppm, and 407.83 ppm in July 2019.


Atmospheric CO2 at Mauna Loa Observatory
Figure 2. Monthly mean CO2 mole fraction in ppm at Mauna Loa observatory from March 1958 to July 2020. The dashed red line represents the monthly mean values, centered on the middle of each month. The black line represents the same, after correction for the average seasonal cycle. Source: NOAA Global Monitoring Laboratory – Earth System Research Laboratories 


Concentration variability and COVID-19

There is substantial variability in the levels of GHGs withinindividual years (seasonal cycle), between years and across geographical regions. The seasonal cycle in the northern hemisphere is mainly dominated by the land biosphere, and it is characterized by rapid decreases – down to 5 ppm to 20 ppm from June to August – and equally rapid increases from September to December. The variability of CO2 in the northern hemisphere is larger than in the southern hemisphere, because most of CO2 sources and sinks are located in the northern hemisphere. The seasonal cycle is larger in amplitude in the northern high and mid-latitudes of the northern hemisphere and smaller in the southern hemisphere due to the large variability in the natural carbon cycle in northern latitudes. Large-scale spatial gradients exist for CH4 and N2O as well.

Monthly mean CO2 mole fraction in ppm from May 1976 to July 2020 at Cape Grim observatory
Figure 3. Monthly mean CO2 mole fraction in ppm from May 1976 to July 2020 at Cape Grim observatory.

The Global Carbon Project (Friedlingstein et al., 2019) estimated that total emissions were partitioned in the atmosphere (44%), ocean (23%) and land (29%), with an unattributed budget imbalance (4%) over the decade of 2009–2018. While the increase of the greenhouse gas concentrations in the atmosphere is driven by human emissions, the interannual changes in the atmospheric CO2 increase rates are modulated by the variability of the sinks, and especially of the land-based biosphere. CO2 growth rate was between 2 and 3 ppm per year within the last 10 years, with the highest increase rate of 3.2 ppm observed in 2016, during the most recent El Niño (WMO, 2016). El Niño typically reduces the intake of CO2 from the atmosphere by vegetation, due the increased extent of droughts over land surfaces associated with El Niño episodes.

The estimated decline for 2020 due to the COVID-19 shutdown (4%–7% compared to 2019 levels, according to the Global Carbon Project) would result in a final change of 0.08 ppm to 0.23 ppm in the annual growth rate, well within the 1 ppm natural interannual variability.

The GAW network of surface stations can resolve global changes of atmospheric CO2 over a year within 0.1 ppm of precision. To distinguish between natural and anthropogenic CO2 sources and sinks, the measurements of the stable isotope Carbon-14 (14C) in CO2 can be used (WMO, 2019). Though rare, such measurements are now being made in several cities and regions around the world, but lab analysis of discrete samples is time consuming.

Long time series are required for robust statistics and complex data modelling using data assimilation techniques in order to differentiate the fossil fuel signal from natural CO2 variability. Emission changes of the order of 10% to 20% are hard to quantify with certainty unless measurements are taken within about 10 km of the fossil fuel emission sources. An example of the significant changes that can be measured within cities (such as proposed in the WMO Integrated Global Greenhouse Gas Information System) is shown in the Integrated Carbon Observation System (ICOS) 2020 where reductions in emissions of up to 75% were measured in the city centres of Basel, Florence, Helsinki, Heraklion, London and Pesaro, using eddy covariance techniques that directly measure vertical exchange fluxes within a several kilometre circumferences of the measurement point.

Footnotes
1 For simplicity of communication the physical quantity related to the amount of gases in the atmosphere (dry mole fraction) is referred to in the text as concentration. 
References
Friedlingstein, P. et al. 2019: Global Carbon Budget 2019. Earth Syst. Sci. Data, 11, 1783–1838
ICOS, 2020: ICOS study shows clear reduction in urban CO2 emissions as a result of Covid-19 lockdown.
WMO, 2016: WMO Greenhouse Gas Bulletin No. 12: The State of Greenhouse Gases in the Atmosphere Based on Global Observations through 2015
WMO, 2019: WMO Greenhouse Gas Bulletin No. 15: The State of Greenhouse Gases in the Atmosphere Based on Global Observations through 2018

Global Carbon Project

Global fossil fuel emissions in 2019 were slightly higher than in 2018, with record emissions of 36.7 Gigatonnes (Gt = billion metric tonnes) of carbon dioxide (CO2) (Figure 1). Emissions growth has slowed to around 1% per year in the last decade, down from 3% annual growth during the 2000s. The near-zero growth seen in 2019 gives hope that the CO2 emissions trend is stabilizing, and that a decline is on the horizon. Nonetheless, stable or slightly declining emissions were seen earlier in the 2010s and, disappointingly, have not endured. Total fossil CO2 emissions are now 62% higher than emissions at the time international climate negotiations began in 1990.

Slower emissions growth in 2019 was driven by a decline in coal emissions (–1.7%; with respect to changes between 2018 and 2019), particularly in the United States and Europe, and growth in renewable energy globally. However, offsetting these reductions was the continued and steady growth in CO2 emissions from the combustion of natural gas (2.0%) and oil (0.8%).

An additional 5.5 Gt CO2 per year on average (2009–2018) are added to the atmosphere from the net impact of land use change (e.g. deforestation, degradation, reforestation). Emissions in 2019 were estimated to be 6.2 Gt CO2, above the long-term average due to excess fires in tropical regions, particularly in the Amazon. Total anthropogenic CO2 emissions in 2019, fossil and land use change, were 42.9±2.8 Gt CO2.

Emissions in 2020 will show unprecedented changes because of the social and economic turmoil unleashed by the COVID-19 pandemic. Early estimates for fossil CO2 emissions in 2020 show a decline attributable to confinement measures to slow the spread of the COVID-19 pandemic.

During peak confinement in early April 2020, we estimate that daily global fossil CO2 emissions dropped 17% compared to mean daily estimates in 2019 (Figure 2). Although such a drop appears to be unprecedented, the amount emitted at peak confinement was still equivalent to emissions in 2006, just a decade and a half ago. This fact highlights both the steep growth in emissions over the past 15 years and the continued dependence of the global economy on fossil sources for energy.

By early June 2020, global daily fossil CO2 emissions had mostly recovered to within 5% (1%–8% range) compared to the same period in 2019, showing the rapid return of emissions, as many countries loosened their confinement restrictions.

The projected emissions decline for year 2020 will depend on the continued trajectory of the pandemic and government responses to address it. We estimate a decline for 2020 approximately in the range of 4% to 7% compared to 2019 levels, depending on different pandemic scenarios.

Surface transport, mainly road transport, contributed the most to the peak decline in early April, followed by industry, the power sector, aviation, public buildings and commerce (Figure 3).

This range of emission reductions we project for 2020 is similar in magnitude to the year-on-year emission reductions needed to limit global warming to 1.5 °C, and well below 2 °C, in line with the objectives of the Paris Agreement.

Figure 4. Global CH4 Budget for 2017 including all major natural and anthropogenic sources and sinks. From Jackson et al. (2020) and Saunois et al. (2020).
Figure 4. Global CH4 Budget for 2017 including all major natural and anthropogenic sources and sinks.
From Jackson et al. (2020) and Saunois et al. (2020).


Methane (CH4) is the second most important greenhouse gas attributable to human activities after CO2. Both emissions and atmospheric concentrations of CH4 have continued to grow for decades, albeit with a short period of relative stabilization from 2000 to 2006. Since then, both agriculture, particularly livestock, and fossil fuels, particularly the natural gas and oil sectors followed by coal mining, have been roughly equally responsible for the emissions growth.

Recent analyses also show that neither changes in CH4 emissions from wetlands, which account for one third of global emissions, nor changes in the methane sink strength can explain to any significant degree the observed atmospheric increase. These findings underscore the dominant role of human activities in the atmospheric loading of CH4, contributing 60% of global emissions overall (Figure 4).

Current trends in emissions of CO2 and CH4 are not compatible with emission pathways consistent with limiting global warming at 1.5 °C or well below 2 °C above pre-industrial levels, the goal of the Paris Agreement (Figure 5). Unless emissions peak and decline soon, temperature stabilization well below 2 °C will be unlikely. The extent to which world leaders consider climate objectives in their economic responses to COVID-19 is likely to influence the pathway of CO2 emissions for decades to come.

Figure 5. Estimated fossil CO2 and CH4 emissions from all human activities presented against the socio-economic pathways (SSPs) to 2050
Figure 5. Estimated fossil CO2 and CH4 emissions from all human activities presented against the socio-economic pathways (SSPs) to 2050.


References
Friedlingstein, P. et al. 2019: Global Carbon Budget 2019, Earth Syst. Sci. Data, 11, 1783–1838
Peters, G.P. et al. 2020. Carbon dioxide emissions continue to grow amidst slowly emerging climate policies. Nat.Clim.Change, 10, 3–6
Le Quéré, C. et al. 2020: Temporary reduction in daily global CO2 emissions during the COVID-19 forced confinement. Nat. Clim. Change, 14:121001
Saunois, M. et al. 2020: The Global Methane Budget 2000–2017, Earth Syst. Sci. Data, 12, 1561–1623
Jackson, R. B. et al. 2020: Increasing anthropogenic methane emissions arise equally from agricultural and fossil fuel sources. Environ. Res. Lett. 15, 071002

2016–2020 set to be warmest five-year period on record

WMO LogoThe average global mean surface temperature1 for 2016–2020 (2020 data are based on averages January to July) will be among the warmest of any equivalent period on record (Figure 1). It is currently estimated to be 1.1 °C (±0.1°C) above pre-industrial2 (1850–1900) times and 0.24 °C (±0.10°C) warmer than the global mean surface temperature for 2011–2015.

The 2016–2020 five-year average temperatures are on course to be the highest on record for much of Europe, the Middle East and northern Asia, southern and eastern areas of the US, areas of South America, southern Africa and Australia (Figure 2). However, exceptional warmth in the first half of 2020 is likely to ease as the year progresses.

Global sea-level rise is increasing

The total elevation of the global mean sealevel over the altimetry era (since January 1993) has reached 90mm. The average rate of rise is estimated to be 3.2 ±0.3mm/yr over the 27-year period (Figure 3). The rate between 2011–2015 and 2016–2020 has increased from 4.1 mm/yr to 4.8 mm/yr. A greater loss of ice mass from the ice sheets is the main cause of the increased rise in the global mean sea-level on top of steady increases from the expansion of ocean waters driven by warming. According to IPCC (2019)3 the average rate of rise for 2006-2015 is 3 to 4 mm/yr, which is about 2.5 times the rate for 1901–1990 of 1 to 2 mm/yr.

Figure 2: 2016-2020 five-year average temperature anomalies relative to the 1981-2010 averageFigure 3. Time series of altimetry-based global mean sea level for the period 1993–16 July 2020. The thin black line is a quadratic function showing the mean sea-level rise acceleration
Figure 2: 2016-2020 five-year average temperature anomalies relative to the 1981-2010 average. Data are from NASA GISTEMP v4. Data for 2020 to July.
 
Figure 3. Time series of altimetry-based global mean sea level for the period 1993–16 July 2020. The thin black line is a quadratic function showing the mean sea-level rise acceleration. (Source: European Space Agency Climate Change Initiative sea-level data until December 2015, extended by data from the Copernicus Marine Service as of January 2016 and near real-time Jason-3 as of March 2020).


Sea-ice extent has declined at a rate of 13% per decade

Figure 4. Monthly September and March Arctic sea-ice extent anomalies (relative to the 1981–2010 average) for 1979– 2019
Figure 4. Monthly September and March Arctic sea-ice extent anomalies (relative to the 1981–2010 average) for 1979– 2019 (Sources: US National Snow and Ice Data Center and EUMETSAT Ocean and Sea Ice Satellite Application Facility)

Arctic (as well as sub-Arctic) sea ice has seen a long-term decline in all months during the satellite era (1979–present), with the largest relative losses in late summer, around the time of the annual minimum in September, with regional variations. The long-term trend over the 1979–2019 period indicates that Arctic summer sea-ice extent has declined at a rate of approximately 13% per decade (Figure 4). In every year from 2016 to 2020, the Arctic average summer minimum and average winter maximum sea-ice extent were below the 1981–2010 long term average. In July 2020, the Arctic sea-ice extent was the lowest on record for July. There is very high confidence that Arctic sea-ice extent continues to decline in all months of the year and that since 1979, the areal proportion of thick ice, at least 5 years old, has declined by approximately 90%. In Antarctica, a remarkable feature of both the February minimum and September maximum has been that sea-ice extent values have fallen well below the 1981–2010 average since 2016. The summer sea ice reached its lowest and second lowest extent on record in 2017 and 2018, respectively, with 2018 also being the second lowest winter extent.

One-metre water equivalent glacier ice loss per year

Analysis of long-term variations in glacier mass changes from the European Alps, Scandinavia and the Rocky Mountains provide direct information on the year-to-year variability in these regions. Preliminary estimates for 2018/2019 indicate a negative mass balance with an ice loss of > 1.0 m water equivalent (w.e). Eight out of the 10 most negative mass balance years were recorded after 20104. For the period 2016–2019 data from the World Glacier Monitoring Service (WGMS)4 reference glaciers indicate an average specific mass change of −943 mm5 w.e. per year. This depicts a greater mass loss than in all other past five-year periods since 1950.

Ice sheets losing ice

Figure 5. SMB for the year 1 September 2018 to 31 August 2019
Figure 5. SMB for the year 1 September 2018 to 31 August 2019. Accumulated sum over the year. 2018/2019 is in blue, and the grey line is the long-term average. For comparison, 2011/2012, the record year is shown in red.

Loss from the Greenland and Antarctic ice sheets has increased since the beginning of the 21st century. The combined sea level rise contribution from both ice sheets for 2012–2016 was 1.2 ±0.1 mm yr–1, a 29% increase on 2002–2011. From Antarctica, the 2012–2016 losses are estimated to –199 ±26 Gt yr–1 and the amount of ice lost annually from the Antarctic ice sheet increased at least six-fold between 1979 and 20176. Most of the ice loss takes place by melting of the ice shelves from below, due to incursions of relatively warm ocean water, especially in west Antarctica and to a lesser extent along the peninsula and in east Antarctica.

Between 2006 and 2015, the Greenland Ice Sheet lost ice mass at an average rate of 278 ±11 Gt yr–1 (equivalent to 0.77 ±0.03 mm yr–1 of global sea level rise), mostly due to surface melting7. The total accumulated Surface Mass Balance (SMB)8 between September 2018 and August 2019 (Figure 5) was 169 Gt compared to 368 Gt average SMB over the 1981–2010 period. 2018/2019 SMB ranks as the 7th lowest on record. The surface mass balancewas below normal almost everywhere in Greenland except for the southeast (Figure 6). This was mainly due to a dry winter, a very early start of the melting season and a long, dry, warm summer. More recent SMB data shows that the 2019/2020 season is close to the 1981–2010 average.

High Impact Events influenced by anthropogenic climate change

Figure 6. Map showing SMB anomaly (in mm) across Greenland
Figure 6. Map showing SMB anomaly (in mm) across Greenland (Source: Polar Portal)

Recently published peer reviewed studies show a significant anthropogenic influence on many of the occurred events, either directly, or indirectly (through, for example, influencing atmospheric circulation patterns that contributed to the event). This section focuses on a selection of such events from the 2016– 2020 period.

While few anthropogenic signals have been found in tropical cyclone intensity and frequency9, recent evidence suggests that anthropogenic influence has increased the probability of higher rainfall amount associated with tropical cyclones. During 2016–2020, the largest economic losses were associated with tropical cyclones. Hurricane Harvey, one of the most devastating hurricanes on record, causing more than US$ 125 billion in losses, hit the Houston (USA) area in 2017 – human influence increased the amount of rainfall associated with this hurricane by about 15%10. Tropical Cyclones Idai and Kenneth hit Mozambique in March and April 2019 causing a large loss of life.

Since 2016, droughts have had major impacts, both on society and the economy, in numerous parts of the world. In Africa millions of people required assistance after drought-related food shortages. In east Africa in 2016/2017, 6.7 million people in Somalia were food insecure at the drought’s peak. Drought returned to many parts of southern Africa in 2018/2019, with Zimbabwe amongst the worst-affected areas. Some droughts show a direct or indirect human influence, including the 2016/2017 East African drought which was strongly influenced by warm sea-surface temperatures in the western Indian Ocean, to which anthropogenic influences on climate.

Drought and heatwaves substantially increased the risk of wildfires. The three largest economic losses on record from wildfires have all occurred in the last four years. Summer 2019 and 2020 saw unprecedented wildfires in the Arctic region. In June 2019, these fires emitted 50 Mt of CO2 into the atmosphere11.The unusual heat contributed to wide-scale wildfires and the loss of permafrost. The results of a recent attribution study showed with high confidence that the January to June 2020 heat is at least 600 times more likely as a result of human-induced climate change12. In 2019 and 2020 there were also widespread fires in the Amazon rainforest, with dramatic environmental impacts.

Eastern Australia experienced a severe and prolonged wildfire season in late 2019, with major fires in early September that continued into early 2020. More than 10 million hectares were burnt over an area extending from southern Queensland to eastern Victoria, while other major fires occurred in South Australia. At least 33 deaths were reported, and preliminary assessments indicate economic losses of several billion US dollars. The likelihood of the weather conditions that led to those wildfires has increased by at least 30% since 1900, as a result of anthropogenic climate change13.


Footnotes
1 Baseline information 
2 Baseline information on datasets 
3 IPCC, 2019: IPCC Special Report on the Ocean and Cryosphere in a Changing Climate [H.-O. Pörtner, et al. (eds.)], in press
4 WGMS data and products can be found at https://wgms.ch/global-glacier-state/
5 A value of -1.0 m w.e. per year is representing a mass loss of 1,000 kg/m2 of ice cover or an annual glacier-wide ice thickness loss of about 1.1 m per year, as the density of ice is only 0.9 times the density of water (source: WGMS)
6 Rignot, E. et al. 2019: Four decades of Antarctic Ice Sheet mass balance from 1979–2017. Proc. of the Nat. Acad. of Sci. of the USA (PNAS, 116, 1095–1103)
PCC, 2019: IPCC Special Report on the Ocean and Cryosphere in a Changing Climate [H.-O. Pörtner, et al. (eds.)], in press
8 WMO, 2020: State of the global climate in 2019, WMO-No.1248
9 IPCC, 2019: IPCC Special Report on the Ocean and Cryosphere in a Changing Climate [H.-O. Pörtner, et al. (eds.)], in press
10 van Oldenborgh, G.J. et al. 2017: Attribution of extreme rainfall from Hurricane Harvey, August 2017. Environ. Res. Lett., 12:124009aa9ef2
11 Baseline information 
12 Baseline information 
13 van Oldenborgh, G.J. et al. 2020: Attribution of the Australian bushfire risk to anthropogenic climate change, Nat. Hazards Earth Syst. Sci. Discuss., Figure 6. Map showing SMB anomaly (in mm) across Greenland (Source: Polar Portal, polarportal.dk/en) https://doi.org/10.5194/nhes-2020-69, in review

Why do changes in the ocean and cryosphere matter? (IPCC, 2019)

IPCCThe global ocean covers 71% of the Earth surface. Around 10% of Earth’s land area is covered by glaciers or ice sheets. The ocean and cryosphere support unique habitats and are interconnected with other components of the climate system through global exchange of water, energy and carbon.

The responses of the ocean and cryosphere include climate feedbacks, changes over decades to millennia, thresholds of abrupt change, and irreversibility (Figure 1).

The state of the ocean and cryosphere affects food and water supply, renewable energy, infrastructure, health and well-being, cultural values, tourism, trade and transport.


Cascading effects
Figure 1. Schematic of the concept of cascading effects associated with changes in the ocean and cryosphere in a changing climate. Cascading effects, where changes in one part of a system inevitably affect the state in another, and so forth, ultimately affecting the state of the entire system. These cascading effects can also trigger feedbacks, altering the forcing (Source, IPCC SROCC Report, Chapter 6, Figure 6.2 (for information on the year from 1998 to 2017, type of hazard, region, characteristics of severity, attribution to anthropogenic climate change and impacts and costs, see Table 6.2 in that chapter)).


What are observed changes in the cryosphere?

Ice sheets and glaciers worldwide have lost mass. Between 2006 and 2015, the Greenland Ice Sheet lost ice mass at an average rate of 278 ±11 Gt yr–1, mostly due to surface melting. In 2006–2015, the Antarctic Ice Sheet lost mass at an average rate of 155 ±19 Gt yr–1, mostly due to rapid thinning and retreat of major outlet glaciers draining the West Antarctic Ice Sheet. Glaciers worldwide outside Greenland and Antarctica lost mass at an average rate of 220 ±30 Gt yr–1 in 2006–2015.

Arctic June snow cover extent on land declined by 13.4 ±5.4% per decade from 1967 to 2018, a total loss of approximately 2.5 million km2, predominantly due to surface air temperature increase. In nearly all high mountain areas, the depth, extent and duration of snow cover have declined over recent decades, especially at lower elevation.

Between 1979 and 2018, Arctic sea-ice extent has decreased for all months of the year. September sea ice reductions are 12.8 ±2.3% per decade. These sea-ice changes in September are likely unprecedented for at least 1000 years. Approximately half the observed sea-ice loss is attributable to increased atmospheric greenhouse gas concentrations.

Permafrost temperatures have increased to record high levels. Arctic and boreal permafrost contain 1460 to 1600 Gt of organic carbon, almost twice the carbon in the atmosphere.

Antarctic sea-ice extent overall has had no statistically significant trend (1979–2018) due to contrasting regional signals and large interannual variability.

Cryospheric and associated hydrological changes have impacted land-based and freshwater species, especially ecosystems in high mountain and polar regions.

Increasing wildfire and abrupt permafrost thaw, as well as changes in Arctic and mountain hydrology, have altered the frequency and intensity of ecosystem disturbances.

Since the mid-20th century, the shrinking cryosphere in the Arctic and high mountain areas has led to predominantly negative impacts on food security, water resources, water quality, livelihoods, health and well-being, infrastructure, transportation, tourism and recreation as well as on our culture.

What are observed changes in the ocean?

The global ocean has warmed unabated since 1970 and has taken up more than 90% of the excess heat in the climate system. Since 1993 the rate of ocean warming, and thus heat uptake has more than doubled and is attributed to anthropogenic forcing. The Southern Ocean accounted for 35% to 43% of the total heat gain in the upper 2000 m global ocean between 1970 and 2017. Its share increased to 45% to 62% between 2005 and 2017.

The deep ocean below 2000 m has warmed since 1992, especially in the Southern Ocean. Marine heatwaves (Figure 2), defined as daily sea surface temperature exceeding the local 99th percentile over the period 1982 to 2016, have doubled in frequency and have become longer-lasting, more intense and more extensive. Between 84% to 90% of marine heatwaves that occurred between 2006 and 2015 are attributable to anthropogenic temperature increase. Marine heatwaves have already resulted in large-scale coral bleaching events at increasing frequency causing worldwide reef degradation since 1997, and recovery is slow if it occurs.


Location where extreme events with an identified link to ocean changes have been discussed in the SROCC report.
Figure 2. Location where extreme events with an identified link to ocean changes have been discussed in the SROCC report. For many of these selected events, the method of event attribution has been used to estimate the role of climate change using either a probabilistic approach (using ensembles of climate models to assess how much more likely the event has become with anthropogenic climate change compared to a world without), or a storyline approach which examines the components of the climate system that contribute to events and how changes in the climate system affect them. (Source, IPCC SROCC Report, Chapter 6, Figure 6.2 (for information on the year from 1998 to 2017, type of hazard, region, characteristics of severity, attribution to anthropogenic climate change and impacts and costs, see Table 6.2 in that chapter)).


Observed surface ocean warming and high latitude addition of freshwater are making the surface ocean less dense relative to deeper parts of the ocean and inhibiting mixing between surface and deeper waters. This has contributed to a loss of oxygen in the open ocean of 0.5% to 3.3% over the upper 1000 m in 1970–2010.

The ocean has taken up between 20% to 30% of total anthropogenic CO2 emissions since the 1980s causing further ocean acidification. The decline in surface ocean pH has already emerged from background natural variability for more than 95% of the ocean surface area.

Since about 1950 many marine species have undergone shifts in geographical range and seasonal activities in response to ocean warming, sea-ice change and oxygen loss. This has resulted in shifts in species composition, abundance and biomass production of ecosystems, from the equator to the poles.

What is the observed sea-level change?

Global mean sea-level is rising, with acceleration in recent decades due to increasing rates of ice loss from the Greenland and Antarctic ice sheets, as well as continued glacier mass loss and ocean thermal expansion.

The rate of global mean sea-level rise for 2006–2015 of 3.6 ±0.5 mm yr–1 is unprecedented over the last century. The sum of ice sheet and glacier contributions over the period 2006–2015 is the dominant source of sea level rise, exceeding the effect of thermal expansion of ocean water. The dominant cause of global mean sea-level rise since 1970 is anthropogenic forcing.

Increases in tropical cyclone winds and rainfall, and increases in extreme waves, combined with relative sea-level rise, exacerbate extreme sea-level events and coastal hazards (Figure 2). There is emerging evidence for an increase in annual global proportion of Category 4 or 5 tropical cyclones in recent decades.

Restoration of vegetated coastal ecosystems, such as mangroves, tidal marshes and seagrass meadows (coastal ‘blue carbon’ ecosystems), could provide climate change mitigation through increased carbon uptake and storage of around 0.5% of current global emissions annually, and multiple other benefits (e.g. storm protection, improving water quality, and benefiting biodiversity and fisheries). Improving the quantification of carbon storage and greenhouse gas fluxes of these coastal ecosystems will reduce current uncertainties around measurement, reporting and verification.

What is the role of climate information in implementing effective responses to climaterelated changes in the ocean and cryosphere?

Key enablers include education and climate literacy, observations, monitoring and forecasting, use of all available knowledge sources, sharing of data, information and knowledge. Sustained long-term monitoring, sharing of data, information and knowledge and improved context-specific forecasts, including early warning systems, help to manage negative impacts from ocean changes such as losses in fisheries, and adverse impacts on human health, food security, agriculture, coral reefs, aquaculture, wildfire, tourism, conservation, drought and flood.


Reference
IPCC, 2019: Summary for Policymakers. In: IPCC Special Report on the Ocean and Cryosphere in a Changing Climate [H.-O. Pörtner, et al. D.C. Roberts, V. Masson-Delmotte, P. Zhai, M. Tignor, E. Poloczanska, K. Mintenbeck, A. Alegría, M. Nicolai, A. Okem, J. Petzold, B. Rama, N.M. Weyer (eds.)]. In press.


Climate and water resources

WMO LogoThe changes that are happening in our climate system have started to impact and will have more pronounced impacts on our planet. The United Nations World Water Development Report (UNESCO, 2019) lists three key water related impacts of a changing climate: 1. Increases in water-related disasters, 2. Increases in areas suffering from water stress, and 3. Increases in poor water quality related fatalities. Currently, 90% of the impact of natural disasters is water related (Figure 1).

By 2050, the number of people at risk of floods will increase from its current level of 1.2 billion to 1.6 billion. In the early to mid-2010s, 1.9 billion people, or 27% of the global population, lived in potential severely water-scarce areas. In 2050, this number will increase between 42% and 95%, or 2.7 to 3.2 billion people. As of 2019, 12% of the world population drinks water from unimproved and unsafe sources.

More than 30% of the world population, or 2.4 billion people, live without any form of sanitation. Over 800 children die everyday from diarrhea associated with unsafe water, poor sanitation and hygience (UNICEF, 2017).

Global warming is projected to increase the number of water-stressed regions and exacerbate shortages in already waterstressed regions (Figure 2). Global freshwater withdrawals for agriculture, industry and municipal use have increased by a factor of six since 1900 (Ritchie and Roser, 2018), 70% of these are used for agriculture. Low income countries use on average 90% of their freshwater for agriculture, while many developed countries use less than 40%.

Figure 2. Per Capita Water Availability and Future Population Growth, 2050 (Damania et al. 2017)

Water storage is essential for food security. Grill et al. (2015) studied the expected growth in dam construction to 2030 and estimated that as of 2015, 43% of river volume is moderately to severely impacted by either flow regulation, fragmentation, or both. They report that by 2030 most affordable potential water storage sites are likely to have been constructed, leaving only more challenging options available for further development, whilst demand will continue to increase. At the same time, Annandale et al. (2016) report that net water storage worldwide is falling due to sedimentation.

The cryosphere is an important source of freshwater in mountains and their downstream regions. There is high confidence that annual runoff from glaciers has reached peak water now for Central Europe and Caucasus and will reach peak water globally at the latest by the end of the 21st century. After that, glacier runoff is projected to decline globally with implications for water storage (Hock et al. 2019).

Figure 3. Third Pole on the Tibetan Plateau region: glaciers and cryosphere fed rivers (Yao et al. 2020)

It is estimated that the Tibetan Plateau region will reach peak water between 2030 and 2050. As runoff from snow cover, permafrost and glaciers in this region (Figure 3) provides up to 45% of the total river flow, the flow decrease would affect water availability for 1.7 billion people with a gross domestic product (GDP) of US$ 12.7 trillion (Yao et al. 2020).

The emerging risks associated with the declining snow, glaciers, permafrost, sea ice, and the Greenland and the Antarctica ice sheets, challenge our ability to achieve the Sustainable Development Goals (SDGs) (Hock et al. 2019), and more specifically, ensuring water availability (SDG6), achieving food security (SDG2), ensuring access to affordable energy for all (SDG7), and combating climate change (SDG13).

The hydrological cycle, including ice and snow dynamics determines current and future access to fresh water. Expected increase in water demand can be addressed by means of two broad policy options: increase the water supply available or decrease demand for water (become more water efficient).

Figure 4. Evolution of September Arctic sea-ice area over the historical period and following three scenario projections for all available CMIP6 models (adapted from SIMIP Community, 2020)

The first U.S. intelligence Community Assessment of Global Water Security predicts that by 2030 humanity’s “annual global water requirements” will exceed “current sustainable water supplies” by 40%. Absent major policy interventions, water insecurity will generate widespread social and political instability.

Most simulations to date project that the Arctic Ocean will experience a first practically sea-ice free (sea-ice area < 1 million km2) September in 2050 (Figure 4). These simulations confirm that cutting greenhouse gas emissions remains vital to prevent the worst impacts on the Arctic.

The fate of Antarctic sea ice is more uncertain. Models project sea-ice loss (SIMIP Community, 2020) over the 21st century in all scenarios, but confidence in the rate of loss is limited (Roach et al. 2020).


References
Annandale, G. et al. 2016: Extending the Life of Reservoirs: Sustainable Sediment Management for Dams and Run-of-River Hydropower. Directions in Development. Washington, DC: World Bank. doi: 10.1596/978-1-4648-0836-8.
Damania, R. et al. 2017: Uncharted Waters: The New Economics of Water Scarcity and Variability. Washington, DC: World Bank. doi:10.1596/978-1- 4648-1179-1.
Grill, G. et al. 2015: An index-based framework for assessing patterns and trends in river fragmentation and flow regulation by global dams at multiple scales. Env. Res. Lett., 10:015001
Hock, R. et al. 2019: High Mountain Areas. In: IPCC Special Report on the Ocean and Cryosphere in a Changing Climate [H.-O. Pörtner, et al. (eds.)]. In press.
MunichRE, 2018: Geo Risks Research, NatCatService as of January 2018
Ritchie, H. and Roser, M. 2018: Water Use and Stress
Roach, L. A. et al. 2020: Antarctic sea ice in CMIP6. Geophys. Res. Lett. 47, e2019GL086729
SIMIP Community 2020: Arctic sea ice in CMIP6. Geophys. Res. Lett. 47, e2019GL086749
UNICEF, 2017: Thirsting for a Future: Water and children in a changing climate. ISBN: 978-92-806-4874-4
Yao, T. et al. 2019: Asian Water Tower Change and Its Impacts. Bull. Chinese Acad. Sci. 34: 1203-1209, DOI 10.16418/j.issn.1000-3045.2019.11.003


WMO Met officeThe WMO Lead Centre for Annual to Decadal Climate Prediction produces a summary of annual to decadal predictions for the coming five years. These predictions are the best estimate of the near term climate as they are based on ten of the world’s leading decadal prediction systems from WMO-designated Global Producing Centres and non-designated contributing centres and include 100 multiple realizations with both observed initial conditions of the type used in seasonal prediction and boundary forcing used to drive long-term climate projections. The predictions do not include any changes in emissions due to COVID-19 effects and they assume that no major volcanic eruptions occur in the period until 2024.

Predicted temperature patterns for 2020–2024 show a high probability for near surface temperatures above the 1981–2010 average almost everywhere, with enhanced warming at high northern latitudes and over land compared to ocean (Figure 1). The Arctic (north of 60°N) anomaly is more than twice as large as the global mean anomaly.

Figure 2 shows that in the five-year period 2020–2024, the annual mean global near surface temperature is predicted to be between 0.91 °C and 1.59 °C above pre-industrial conditions (taken as the average over the period 1850 to 1900). The chance of at least one year exceeding 1.5 °C above pre-industrial levels is 24%, with a very small chance (3%) of the five-year mean exceeding this level. Confidence in forecasts of global mean temperature is high. However, the coronavirus lockdown caused changes in emissions of greenhouse gases and aerosols that were not included in the forecast models. The impact of changes in greenhouse gases is likely small based on early estimates (Le Quéré et al. 2020 and Carbonbrief.org).

Figure 2. Multi-annual predictions of global mean near surface temperature relative to 1981–2010
Figure 2. Multi-annual predictions of global mean near surface temperature relative to 1981–2010. Annual mean observations in black, forecast in blue, hindcasts in green and uninitialized simulations in grey. The shading indicates the 90% confidence range. The probability for above average in the five-year mean of the forecast is given at the bottom the main panel (in brackets the probability for above average in the first year). The inset in the main panel, referring to the right hand axis, is the probability of global temperature exceeding 1.5 °C above pre-industrial levels for a single month or year during the five years starting in the year indicated (Smith et al. 2015; Karl et al. 2015; Morice et al. 2012). Observed temperatures are an average of three observational data sets (Hansen et al. 2010, updated), they are near surface (1.5m) over land and surface temperatures over the ocean. Model temperatures are near surface throughout.


Figure 3. Predictions for 2020–2024 precipitation anomalies relative to 1981–2010. Ensemble mean (left) and probability of above average (right). As this is a two-category forecast, the probability for below average is one minus the probability shown in t
Figure 3. Predictions for 2020–2024 precipitation anomalies relative to 1981–2010. Ensemble mean (left) and probability of above average (right). As this is a two-category forecast, the probability for below average is one minus the probability shown in the right column.

Precipitation forecasts for 2020–2024 (Figure 3) suggest an increased chance of drier conditions over northern South America, the Mediterranean and southern Africa and wetter conditions in northern Eurasia, Alaska and Canada. Prediction skill is moderate though significant in these regions, giving low to medium confidence in the forecast.

Precipitation predictions for 2020–2024 favour wetter than average conditions at high latitudes in both hemispheres, but confidence is low because observations are insufficient for assessing skill except over land. Overall, the pattern of increased precipitation in the tropics and high latitudes and reduced precipitation in the subtropics compared to 1981–2010 is consistent with the effects of increased greenhouse gases as the climate warms. There is moderate but significant correlation skill over the Sahel, parts of South America and across northern Europe and Eurasia, giving medium confidence in the forecast for an increased chance of precipitation in these regions.

In conclusion, predictions for 2020–2024 suggest that:

  • Annual global temperature is likely to be at least 1 °C higher than pre-industrial levels (defined as the 1850–1900 average) in each of the coming 5 years and is very likely to be within the range 0.91 to 1.59 °C.
  • It is unlikely (~20% chance) that average global near surface temperature in one of the next 5 years will be at least 1.5 °C warmer than pre-industrial levels, but the chance is increasing with time.
  • It is likely (~70% chance) that one or more months during the next 5 years will be at least 1.5 °C warmer than pre-industrial levels.
  • It is very unlikely (~3%) that the 5-year mean temperature for 2020–2024 will be 1.5 °C warmer than preindustrial levels.
  • Over 2020–2024, large land areas in the northern hemisphere are likely to be over 0.8 °C warmer than the recent past (defined as the 1981–2010 average).
  • Over 2020–2024, near surface temperatures relative to 1981–2010 are likely to be more than twice as warm in the Arctic than the global mean.
  • Over 2020–2024, many parts of South America, southern Africa and Australia are likely to be dryer than the recent past.


UNEPThe United Nations Environment Programme (UNEP) issued its tenth Emissions Gap Report in late 2019 and the preparations for the 2020 report are on track for December 2020. The reports assess the difference between where global greenhouse gas (GHG) emissions are heading and where they need to be for the world to get on track to keeping global warming within the agreed goals in the Paris Agreement.

The findings of the reports are sobering: despite scientific warnings, increased political and societal attention and the Paris Agreement, global GHG emissions have continued to increase and the emissions gap is larger than ever (Figure 1). Even with full implementation of the current Nationally Determined Contributions (NDCs), the Emissions Gap in 2030 will be around 15 Gt of CO2 equivalent (GtCO2e) for a 2 °C goal, and 32 GtCO2e for a 1.5 °C goal (both with a probability of at least 66%). To give an indication of the magnitude of this gap, the total emissions of the six largest emitters, that is, China, USA, EU28, India, Russia and Japan was around 32 GtCO2e in 2018 (Figure 2). The current level of climate ambition sets us on course to a global average temperature increase of 3.0 to 3.2 °C by the end of this century.

Transformational change needed to close the emissions gap

The challenge is clear: if we want to keep the Paris Agreement goals of limiting global warming to well below 2 °C and pursuing a 1.5 °C goal alive, postponing transformational action is not an option. The Emissions Gap Report 2019 showed that to have a likely chance1 of meeting the Paris Agreement goals, the cuts in global emissions required per year from 2020 to 2030 are close to 3% for a 2 °C target and more than 7% per year on average for the 1.5 °C goal.

While the global COVID-19 pandemic is causing significant short-term reductions in global emissions, it will not have significant impact on the longer-term climate mitigation challenge, unless the health crises is used for reflection, and the many stimulus and recovery initiatives are used to “build back better”2. Focus will need to be on activities that have short-term economic benefits, while at the same time setting national development on a low-carbon path. The Emissions Gap Report 2020 will assess the implications of COVID-19 on global emissions and the emissions gap.


Figure 2. The top emitters of greenhouse gases, excluding land-use change emissions due to lack of reliable country-level data, on an absolute basis (left) and per capita basis (right) (UNEP Emissions Gap Report 2019)


We have the solutions to get on track

Is it then possible to bridge the emissions gap? The short answer is yes, but time is running out. The Emissions Gap Reports have provided a detailed assessment of sectoral mitigation options in 2030, which shows that the economic and technical mitigation potential is sufficient to get on track to well below 2 °C and to 1.5 °C. A substantial part of the short-term potential can be realized through scaling up and replicating existing, well-proven policies that simultaneously contribute to other Sustainable Development Goals.

Figure 3. Global weighted-average levelized costs of electricity of utility-scale renewable power generation technologies, 2010–2018
Figure 3. Global weighted-average levelized costs of electricity of utility-scale renewable power generation technologies, 2010–2018 (UNEP Emissions Gap Report 2019)

One example is how renewables and energy efficiency, in combination with electrification of end uses (including transport) and a phase out of coal, are key to a successful transition of the global energy sector and to driving down energy-related CO2 emissions. Technological and economic developments offer opportunities to decarbonize the energy sector at a cost that is lower than ever. A key example is the cost declines of renewable energy, which continue to outpace projections. Renewables are by now the cheapest source of new power generation in most parts of the world, with the global weighted average purchase or auction price for new solar power photovoltaic systems and onshore wind turbines now competitive with the marginal operating cost of existing coal plants by 2020 (Figure 3).

As there is a significant time lag between policy decisions and the reaping of emission reduction benefits, the 2020–2024 period, which is the first NDC and global stocktake cycle under the Paris Agreement, will be defining for the possibility of bridging the 2030 emissions gap. The new or updated NDCs to be submitted before the 26th session of the Conference of Parties (COP 26) of the United Nations Framework Convention on Climate Change (UNFCCC) will provide an indication of the prospects of achieving the required emission reductions by 2030. Similarly, the global stocktake will provide a preliminary indication of the actual implementation of the NDCs, with the first Biennial Transparency Reports due in 2024 demonstrating the early results of NDC action. Even if new NDCs by 2025 are significantly more ambitious, raising ambition by 2025 will essentially be too late to bridge the 2030 gap as it will not be possible to implement the required action in five years.

New solutions necessary in the longer timeframe

Looking beyond the 2030 timeframe, new technological solutions and gradual change in consumption patterns are needed at all levels and for all sectors. The progress achieved in IT and telecommunication in the last decades provides a clear example of how technological innovation can form a basis for transformational change with significant emissions reductions (Figure 4).


Figure 4. The energy and material benefits of accessing services via a multipurpose smartphone (left) over owning an array of single-purpose goods (right) (UNEP Emissions Gap Report 2019)


Figure 5. Annual emissions from the manufacturing and use of passenger vehicles in the G7 and in China and India,
Figure 5. Annual emissions from the manufacturing and use of passenger vehicles in the G7 and in China and India, in a scenario that follows the Shared Socioeconomic Pathway SSP1 to mitigate emissions to below 2 °C (UNEP Emissions Gap Report 2019)

Where such major transitions are not an opportunity, there will be a need to explore how more integrated approaches can contribute. One area receiving increasing attention is resource efficiency, including aspects of circularity and behavioural change. Based on data from the International Resource Panel, Figure 5 illustrates how material efficiency and substitution combined with behavioural change can reduce emissions associated with production and use of passenger vehicles.To reach net-zero emissions, measures that sequester or remove carbon dioxide from the atmosphere will also be required. A significant part of the options fall under nature-based solutions that are wellproven, but often hampered by social or economic barriers.

In conclusion, the Emissions Gap Reports highlight the enormous challenge facing the global community in achieving the temperature goals of the Paris Agreement. It will require urgent and concerted action by all countries, reflecting the principles of the Convention. The policy and technological options necessary to bridge the 2030 emissions gap are available and ready for implementation, while new technologies and options will be required to realize the longer-term global ambition of achieving net-zero emissions by the middle of this century. No silver bullets exist and all options need to be brought into play.


Footnotes
1 defined as greater than 66% probability in line with the IPCC.
2 See, for example, International Renewable Energy Agency (IRENA), 2020: The post-COVID recovery: An agenda for resilience, development and equality, International Renewable Energy Agency, Abu Dhabi. ISBN 978-92-9260-245-1

UiS Earth Observing System CovidThe COVID-19 pandemic has produced significant impacts on the global observing systems for weather, climate, water and ocean health, which in turn have affected the quality of forecasts and other weather, climate and ocean-related services.


Lead authors and contributors

Overall coordination and editing by WMO: Jürg Luterbacher, Laura Paterson, Kate Solazzo and Sylvie Castonguay (Editor).

Greenhouse Gas Concentrations in the Atmosphere (Global Atmosphere Watch, GAW): Oksana Tarasova (WMO), Alex Vermeulen (Lund University, Sweden).

Global Fossil CO2 emissions (GCP): Josep G Canadell (CSIRO, Australia), Robert B Jackson (Stanford University, USA), Robbie M Andrew (CICERO, Norway), Pierre Friedlingstein (University of Exeter, UK), Matthew W Jones (University of East Anglia, UK), Corinne Le Quéré (University of East Anglia, UK), Glen P Peters (CICERO, Norway), Benjamin Poulter (NASA, USA), Marielle Saunois (LSCE-IPSL, France), Ann Stavert (CSIRO, Australia).

Global Climate in 2016-2020 (WMO): Omar Baddour (WMO), Anny Cazenave (Laboratoire d’Etudes en Géophysique et Océanographie Spatiales, Centre National d’Etudes Spatiales and Observatoire Midi-Pyrénées, France), Matthias Huss (ETH Zurich, Switzerland), John Kennedy (UK Met Office, UK), Peter Siegmund (Royal Netherlands Meteorological Institute, KNMI, Netherland), Blair Trewin (Bureau of Meteorology, BoM, Australia), Markus Ziese (Deutscher Wetterdienst, DWD, Germany).

Ocean and Cryosphere in a Changing Climate (IPCC): Valérie Masson-Delmotte (IPCC WGI co-chair), with inputs from Sarah Connors (WGI TSU, University Paris Saclay, France), Panmao Zhai (IPCC WGI co-chair), Hans-Otto Pörtner (IPCC WGII co-chair) and Debra Roberts (IPCC WGII co-chair).

Water and Cryosphere (WMO): Johannes Cullmann (WMO), Rodica Nitu (WMO), Lijuan Ma (WMO), Bruce Stewart (WMO), Thomas Lavergne (Norwegian Meteorological Institute, Norway), Petra Heil (Australian Antarctic Division, Australia), Tandong Yao (ITPR-CAS, Institute for Tibetan Plateau Research – Chinese Academy of Sciences, China).

Global Climate in 2020–2024 (WMO Global Annual to Decadal Climate Update, led by UK Met Office): Adam Scaife (UK Met Office), Leon Hermanson (UK Met Office), Doug Smith (UK Met Office)

Emissions Gap (UNEP): Anne Olhoff (UNEP DTU Partnership), John Christensen (UNEP DTU Partnership), Maarten Kappelle (UNEP), Jian Liu (UNEP).

Earth System Observations during COVID-19 (UNESCO-IOC and WMO): Emma Heslop (UNESCO-IOC), Albert Fischer (UNESCO-IOC), Salvatore Arico (UNESCO-IOC), Vladimir Ryabinin (UNESCO-IOC), Valentin Aich (WMO), Anthony Rea (WMO), Dean Lockett (WMO), Timo Pröscholdt (WMO).

Related publications

World Meteorological Organization (WMO) ; United Nations Environment Programme ; Intergovernmental Panel on Climate Change ; Global Framework for Climate Services (GFCS)
Published by: WMO; 2019
World Meteorological Organization (WMO)
Published by: WMO ; 2020 (Update)
The Global Climate in 2015–2019 is part of the WMO Statements on Climate providing authoritative information on the state of the climate and impacts.
World Meteorological Organization (WMO)
Published by: WMO; 2019
The report provides case studies, examples and explanations as to the role of climate information and services to support agriculture in the face of climate variability and change…